
Motorcycle power, torque and horsepower: understanding engine performance
100 hp, 90 Nm, 9,000 rpm: what power and torque really measure, how to read a dyno curve and why a single figure is never enough to judge an engine.
“120 PS at 10,000 rpm, 95 Nm at 7,000 rpm.” These two lines open almost every spec sheet, and almost every road test comments on them with phrases such as “torquey engine”, “strong top end” or “flat spot in the midrange”. Yet many riders would struggle to explain exactly what torque and power measure, why they do not peak at the same engine speed, or why a 100 PS motorcycle can feel livelier than a 120 PS one.
This article starts from basic physics and works its way to what you feel at the handlebars. By the end, you will be able to read a spec sheet and a dyno chart, decode the vocabulary of road testers and compare two motorcycles without being misled by a single figure.
How is a motorcycle engine’s performance described?
What a spec sheet tells you
The “engine” section of a spec sheet usually includes:
- the layout: number of cylinders, arrangement (inline, V, flat), four-stroke cycle, cooling;
- the displacement, in cc, and the bore × stroke (the cylinder diameter and the distance travelled by the piston);
- the compression ratio;
- peak power, in kilowatts and horsepower, with the engine speed at which it is reached;
- peak torque, in newton-metres, with its engine speed;
- sometimes fuel consumption, CO₂ emissions and the emissions standard.
The two figures that attract the most attention are peak power and peak torque. They always come with an engine speed, expressed in revolutions per minute (rpm): the rotational speed of the crankshaft when that value is reached.
Peak power, peak torque and engine speed
These three quantities are linked, and most of this article explains how:
- torque measures the turning effort the engine applies to its crankshaft;
- engine speed measures how fast that crankshaft turns;
- power combines the two: it is the amount of energy the engine delivers each second.
An engine does not deliver a single torque or a single power figure: both vary constantly with engine speed. The spec sheet only gives their peak values, in other words two points on two curves.
Why manufacturers publish these figures
First, because they have to. In the European Union, peak power is part of a vehicle’s type-approval data, measured using a regulated method, and it appears in kilowatts on the registration certificate. It also determines access to licence categories: a motorcycle accessible on an A2 licence must not exceed 35 kW.
Second, because they are simple commercial benchmarks that are easy to compare. But a peak value says nothing about how the engine behaves at other engine speeds, and that is often where riding pleasure is decided.
Engine figures are not motorcycle performance
Claimed power and torque describe the engine, measured on its own on a dyno, at the crankshaft. What you feel depends on the whole motorcycle: its weight and yours, its gear ratios, its final drive, the grip of its rear tyre, its aerodynamics, its electronics. Two motorcycles fitted with the same engine can accelerate differently: Yamaha, for example, has fitted the same 689 cc, 73.4 PS twin to the MT-07, the XSR700 and the R7, three motorcycles with different weights, riding positions and bodywork.
An example to fix ideas
Take a fictitious but realistic spec sheet: 120 PS at 10,000 rpm and 95 Nm at 7,000 rpm. It tells us that:
- the engine produces its highest turning effort, 95 Nm, at 7,000 rpm;
- it delivers the most energy per second, 120 PS, at 10,000 rpm;
- between 7,000 and 10,000 rpm, torque falls but power keeps rising.
That last point often comes as a surprise. Yet it follows directly from physics, as we will see.
What is engine torque?
A force that makes things turn
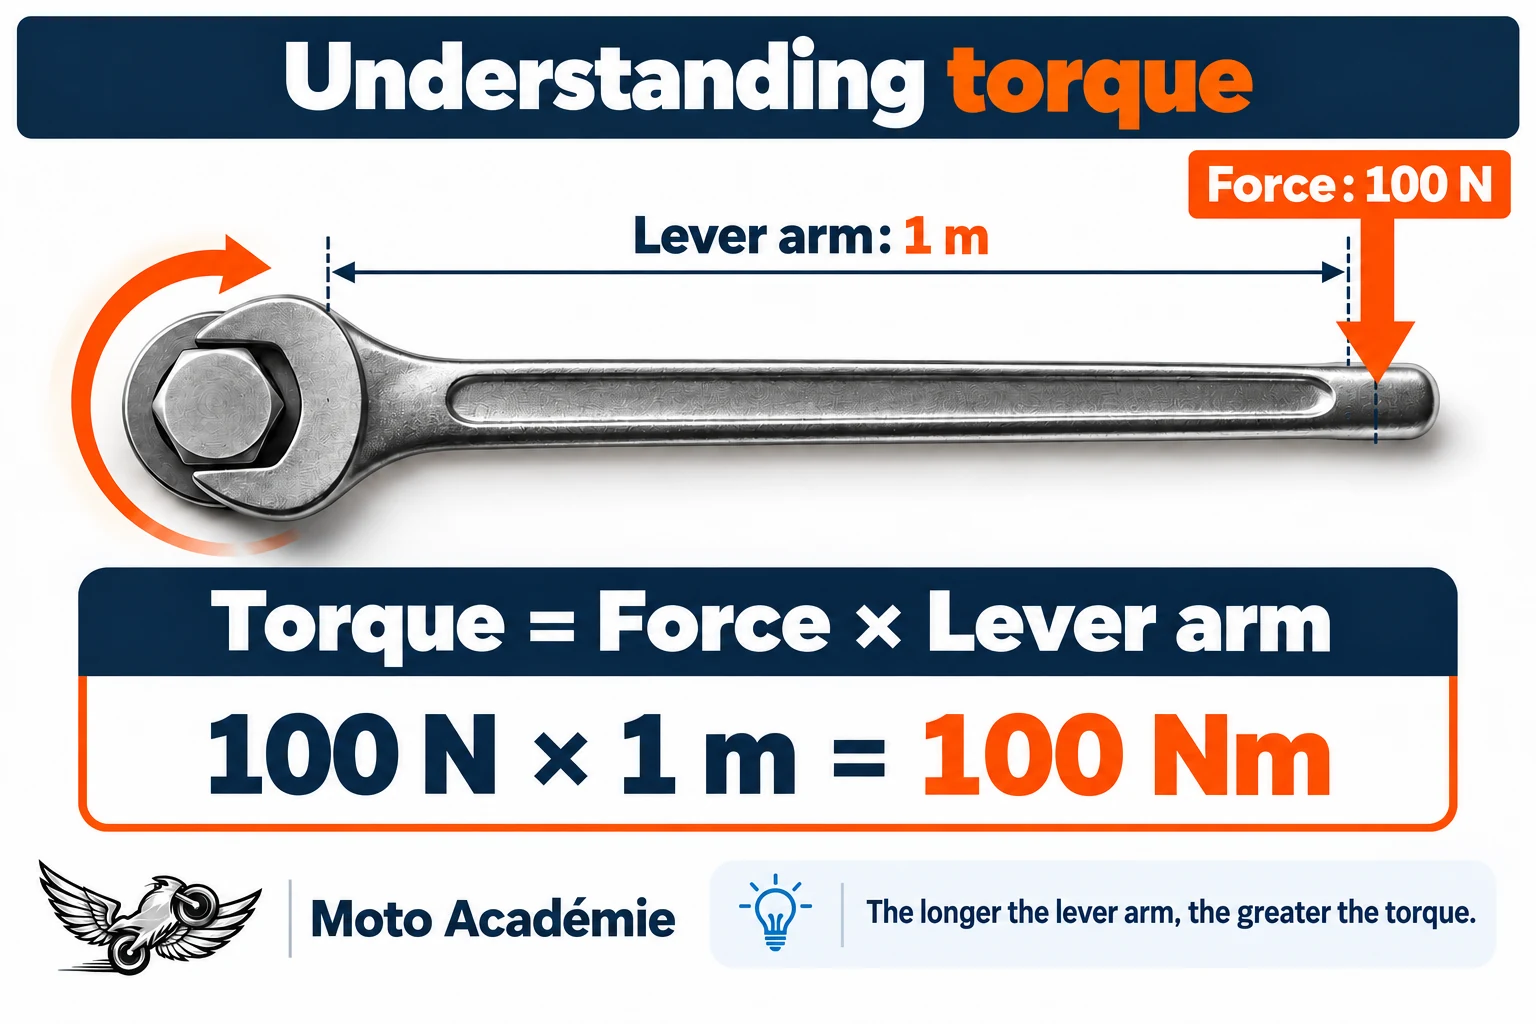
Torque is a “turning force”. Think of a wrench you use to undo a wheel nut: the effect depends on the force you apply and on the length of the handle. The same force applied at the end of a wrench twice as long produces twice the turning effect. Torque is exactly this product: force × lever arm.
Why torque is expressed in newton-metres
Since torque multiplies a force (in newtons, N) by a distance (in metres, m), its unit is the newton-metre (Nm). A torque of 1 Nm corresponds to a force of 1 newton applied at right angles to the end of a 1-metre lever. For scale, the weight of a 1 kg mass is about 9.81 N on Earth.
English-language documents often use the pound-foot (lb-ft or ft-lb): 1 lb-ft is about 1.356 Nm.
How a combustion engine produces torque
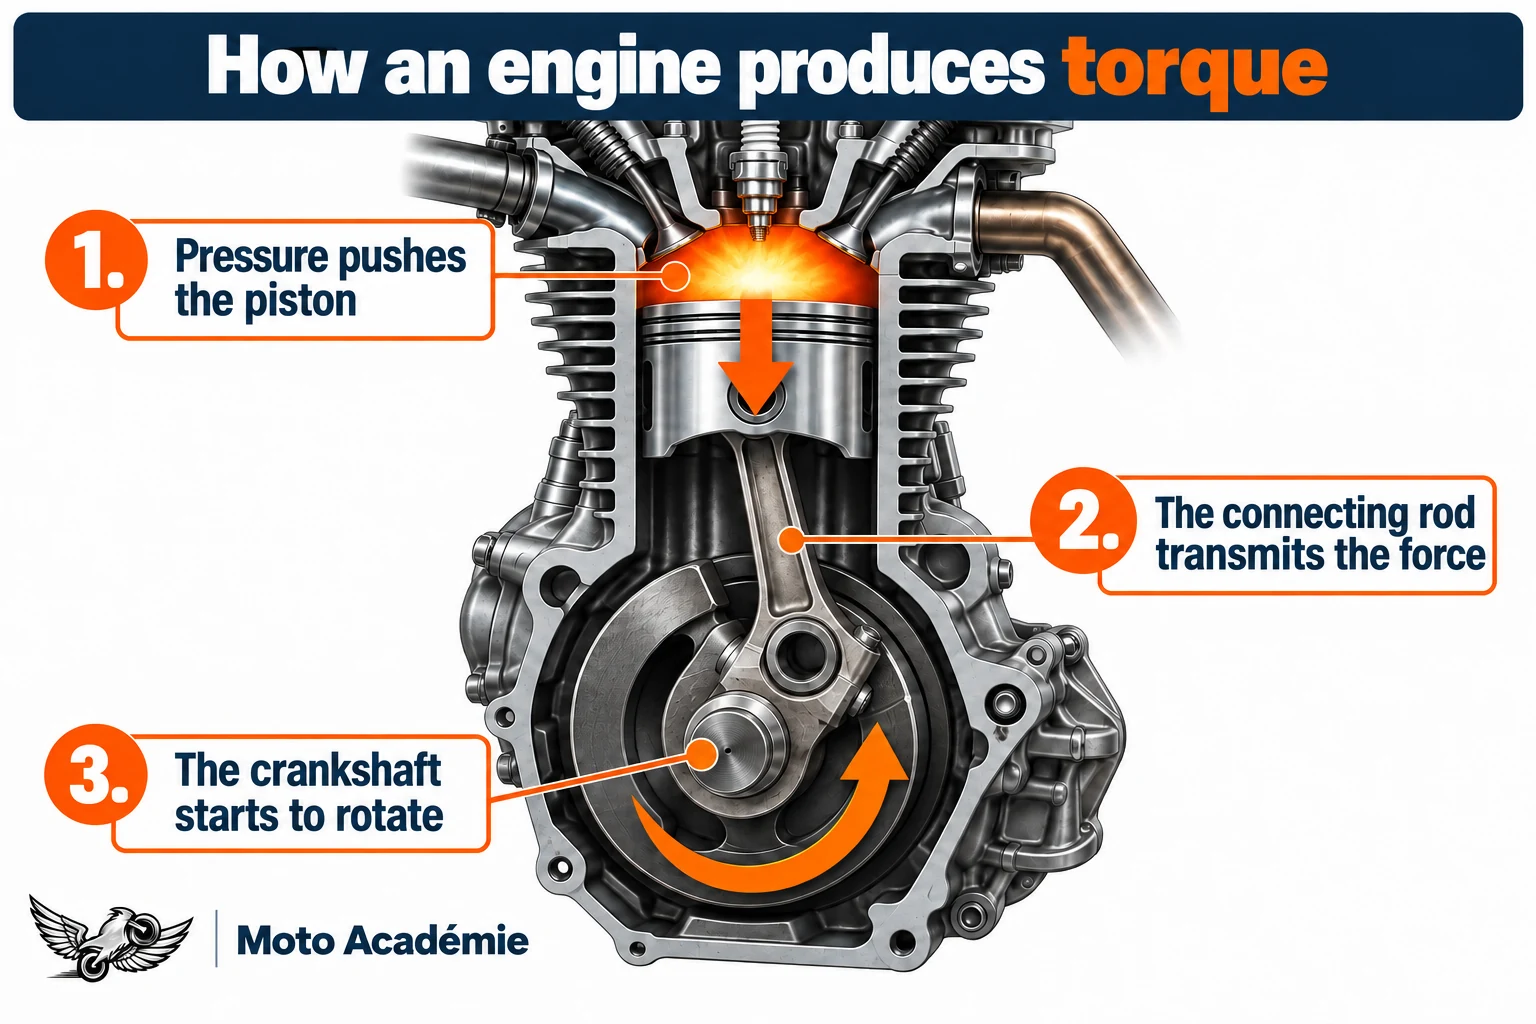
In each cylinder, the air-fuel mixture burns after being compressed. The gas pressure pushes the piston down. The connecting rod transmits this thrust to a crankpin, offset from the axis of rotation: that offset is the lever arm. The connecting rod force, applied at that distance from the axis, produces a torque that turns the crankshaft.
This torque is not constant over a revolution. In a four-stroke engine, each cylinder produces only one power stroke every two revolutions of the crankshaft; the rest of the cycle is spent expelling the burnt gases, drawing in fresh mixture and compressing it, which consumes energy. “Instantaneous” torque therefore varies enormously, and the flywheel and the number of cylinders smooth out these pulses. The torque given on a spec sheet is an average torque, measured at a steady engine speed.
What makes torque: pressure, displacement and design
The average torque of a four-stroke engine is proportional to two quantities:
- displacement: the larger the volume swept by the pistons, the larger the area and stroke over which the gas pressure acts;
- brake mean effective pressure (BMEP): the average pressure that would have to act on the pistons throughout their power stroke to produce the same work. It reflects how well the cylinders are filled, how efficient combustion is and how much energy is lost to friction.
For a four-stroke, the relationship is: torque = BMEP × displacement ÷ 4π. Applying it to manufacturers’ figures for some current motorcycles gives BMEP values at peak torque of between about 10 and 14.5 bar:
| Motorcycle | Displacement | Peak torque | Corresponding BMEP |
|---|---|---|---|
| Royal Enfield Interceptor 650 | 648 cc | 52.3 Nm | ≈ 10.1 bar |
| Honda NC750X | 745 cc | 69 Nm | ≈ 11.6 bar |
| Yamaha MT-07 | 689 cc | 68 Nm | ≈ 12.4 bar |
| Triumph Trident 660 | 660 cc | 68 Nm | ≈ 12.9 bar |
| BMW S 1000 RR | 999 cc | 113 Nm | ≈ 14.2 bar |
| BMW R 1300 GS | 1,300 cc | 149 Nm | ≈ 14.4 bar |
Calculation: BMEP = 4π × torque ÷ displacement, from manufacturers’ data.
This table shows something essential: on naturally aspirated engines, BMEP varies within a fairly narrow range. Peak torque therefore depends first and foremost on displacement. A 1,300 cc engine naturally produces more torque than a 650 cc one. Engine design (combustion chamber shape, valve size, port length, injection and ignition mapping, compression ratio) then shifts BMEP and, above all, determines at what engine speed that torque is produced.
What 100 Nm of torque means
A torque of 100 Nm is equivalent to the effort produced by a force of 100 newtons at the end of a 1-metre arm, roughly the weight of a 10 kg mass hanging from the end of a 1-metre bar attached to the crankshaft. That sounds modest, and it is: engine torque does not push the motorcycle directly. It is heavily multiplied by the transmission before it reaches the wheel, as we will see.
Peak torque and available torque
Peak torque is only available at one engine speed, or over a more or less wide band around it. At 3,000 rpm, an engine rated at 95 Nm at 7,000 rpm delivers only part of it. Our example engine delivers about 70 Nm there.
This is one of the most widespread misconceptions: peak torque is not available at every engine speed. What matters day to day is the torque available where you actually ride, which only a curve can show.
Same peak torque, different behaviour
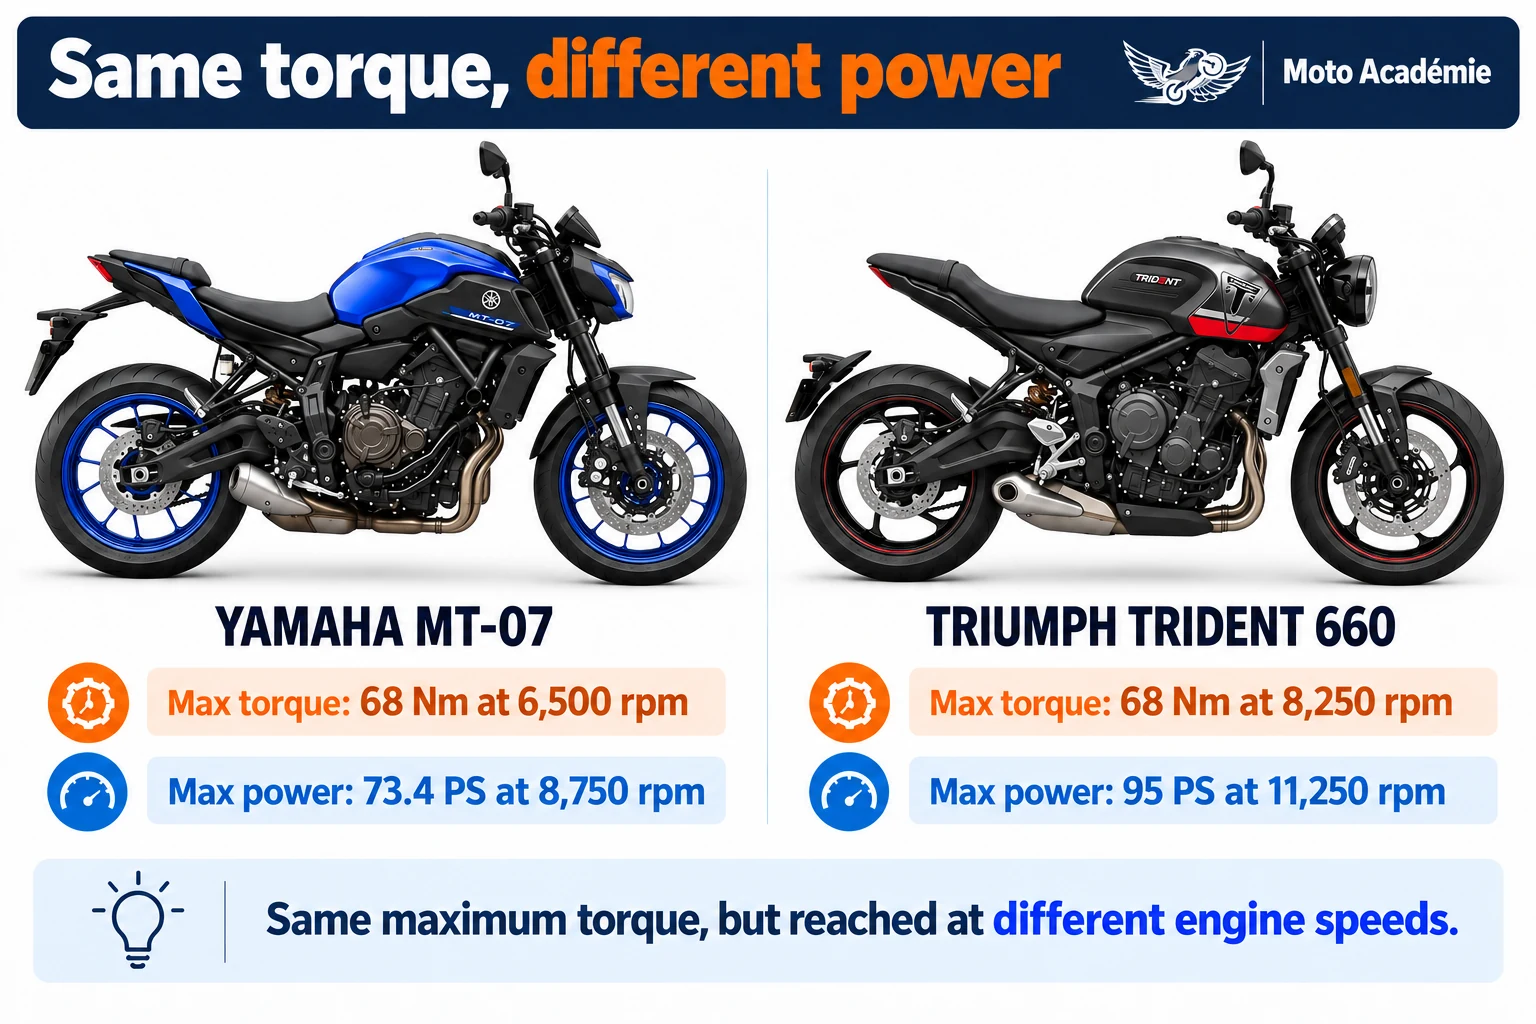
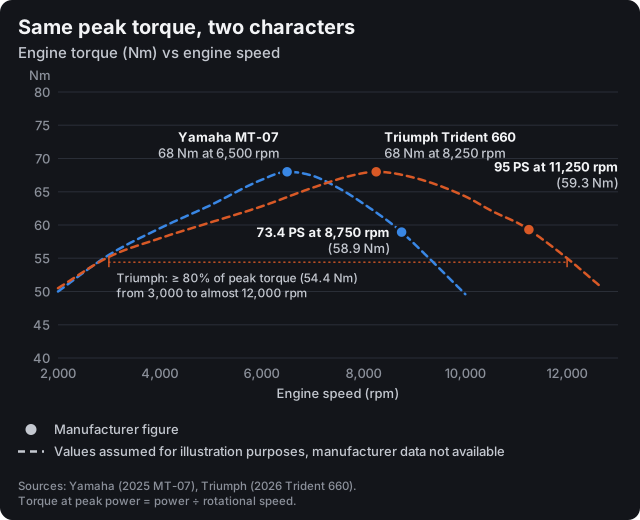
The Yamaha MT-07 and the Triumph Trident 660 both claim 68 Nm. But the first reaches it at 6,500 rpm, the second at 8,250 rpm. The Yamaha twin therefore delivers its peak effort lower down, while the Triumph triple keeps revving well beyond, which allows it to produce 95 PS against 73.4 PS. Same peak torque, very different character and power: the figure alone is not enough.
What is engine power?
Work done per unit of time
In physics, work is the energy transferred when a force moves its point of application. Power is work done per unit of time. Its official unit is the watt (W): 1 watt is 1 joule of energy per second.
The staircase analogy helps you feel the difference. Climbing one floor with a 20 kg bag always takes the same work, whether you walk or run. But if you run, you do that work in less time: your power is higher.
Torque and power: two different things
Torque is an effort, power is a rate of energy flow. An engine can produce a lot of torque without delivering any power: a wrench pushing on a seized nut exerts torque but does no work, because nothing turns. Conversely, a small, very fast turbine can deliver a lot of power with little torque.
The bicycle analogy is the most telling. The force you push on the pedals is torque. The rate at which you pedal is engine speed. The power you produce depends on both: pushing very hard while turning your legs very slowly, or pedalling very fast while barely pushing, does not produce much power. A powerful cyclist combines a strong effort with a high cadence.
Why power depends on torque and engine speed
Each revolution of the crankshaft delivers work proportional to the torque. The more revolutions the engine makes per second, the more work it delivers per second. Power is therefore the product of torque and rotational speed. This relationship, detailed below, is the key to everything else.
What claimed peak power means
Peak power is the highest power the engine can deliver, at full throttle, across its whole rev range. It is reached at a specific engine speed, often close to the maximum permitted engine speed. It largely determines the motorcycle’s top speed and its acceleration at high speed, but it says nothing about what the engine delivers in the midrange.
More power at higher revs, even with less torque
Beyond the peak torque engine speed, each revolution delivers slightly less work, but the engine makes more revolutions per second. As long as engine speed rises faster than torque falls, power keeps increasing. In our example engine, torque falls from 95 Nm at 7,000 rpm to about 84 Nm at 10,000 rpm, an 11% drop, while engine speed rises by 43%: power increases by almost 27%.
Horsepower, kilowatts and metric horsepower: what are the differences?
The origin of horsepower
The word comes from the steam engine. In the late 18th century, the Scottish engineer James Watt wanted to sell his engines as replacements for the horses that then drove pumps and mills. So that his customers could compare, he expressed his engines’ output in “horsepower” and set one horsepower at 33,000 foot-pounds per minute, or 550 foot-pounds per second. Accounts of how he arrived at that figure differ from one source to another; only the definition has survived. The SI unit of power, the watt, was later named in his honour.
Metric horsepower and imperial horsepower
There are two kinds of “horsepower” that are not quite equal:
- metric horsepower (ch in French, PS in German, CV in Italian and Spanish) is defined as the power needed to lift 75 kilograms-force by one metre in one second. It is worth 735.499 W;
- imperial horsepower (hp, or “mechanical horsepower”) corresponds to 550 foot-pounds per second. It is worth 745.700 W, about 1.4% more than metric horsepower.
British and American magazines also use bhp (brake horsepower): power measured at the brake, in other words at the crankshaft, expressed in horsepower. The “b” refers to the measurement method, not to a different unit.
The kilowatt, the official unit
In the International System of Units, power is expressed in watts, and for an engine in kilowatts (1 kW = 1,000 W). Metric horsepower is no longer a legal unit of measurement in the European Union: Directive 76/770/EEC required member states to stop using it by 31 December 1977 at the latest. Directive 80/181/EEC, which now sets the legal units, allows “supplementary indications” in other units, provided the value in legal units remains predominant and the supplementary indication is not printed in larger characters. That is why official documents give power in kilowatts, and why European spec sheets read, for instance, “54 kW (73.4 PS)”. In the United States and the United Kingdom, the horsepower (hp or bhp) remains in everyday use.
Equivalents and conversions
| From | To | Multiply by |
|---|---|---|
| kW | PS | 1.3596 |
| kW | hp | 1.3410 |
| PS | kW | 0.7355 |
| hp | kW | 0.7457 |
| hp | PS | 1.0139 |
| PS | hp | 0.9863 |
Examples: 35 kW (the A2 licence limit) is 47.6 PS or 46.9 hp. A 100 PS engine produces 73.5 kW, or 98.6 hp. For a quick estimate, remember that 1 kW ≈ 1.36 PS and that PS and hp differ by only 1.4%.
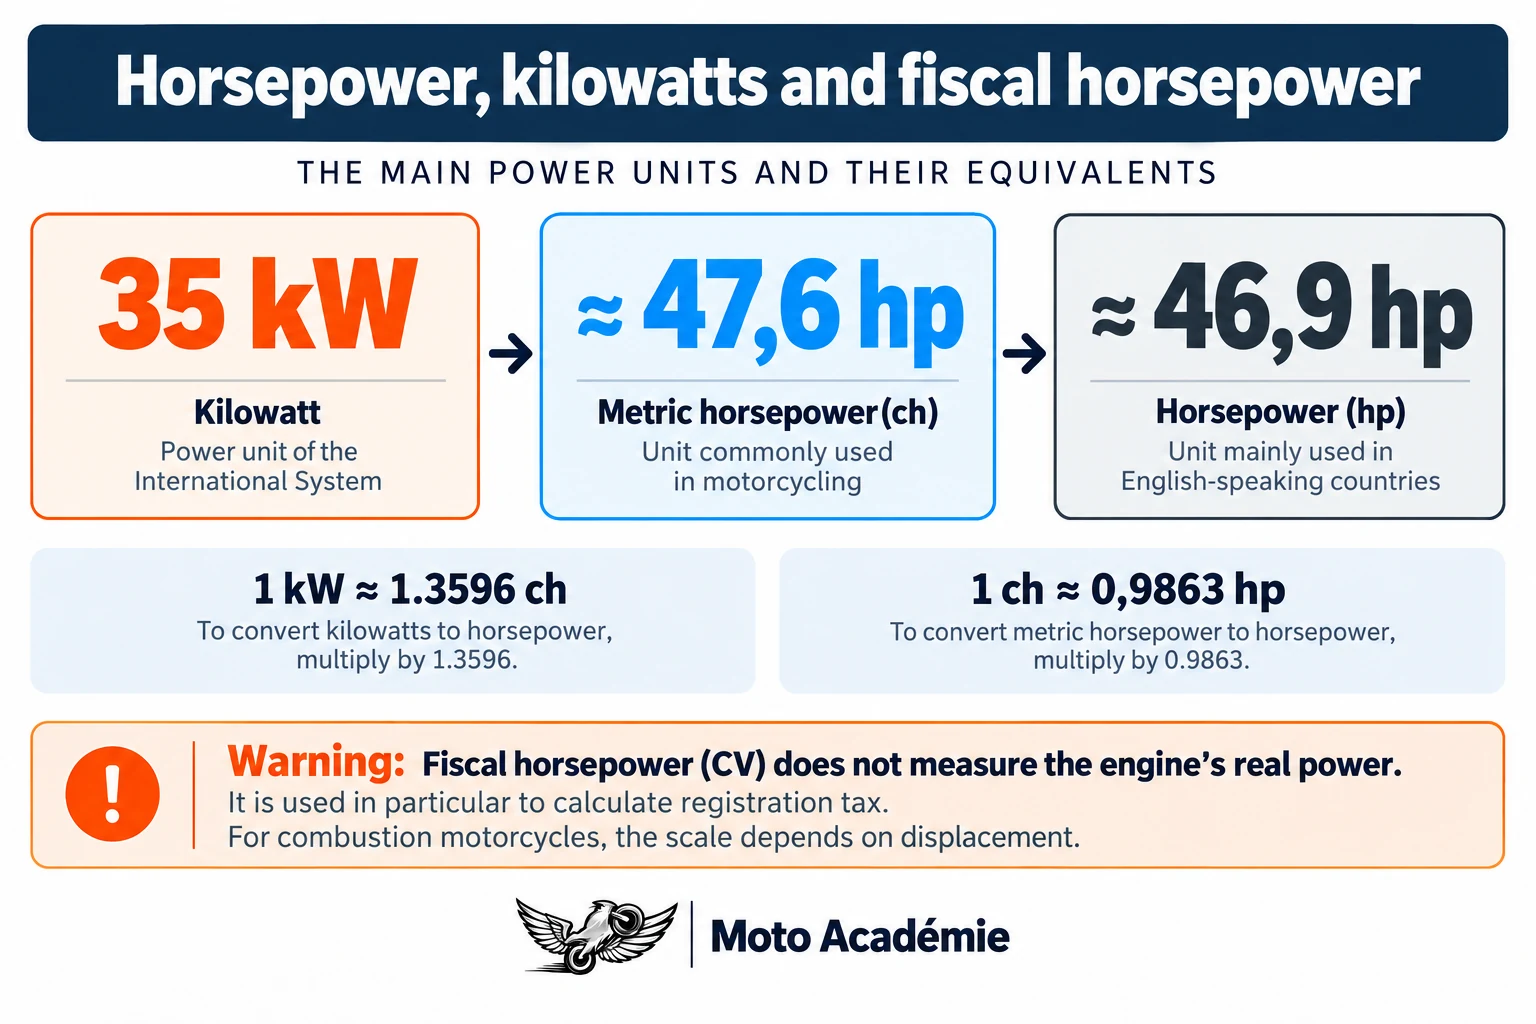
Why spec sheets mix several units
The kilowatt is the regulatory unit, used for type approval and on the registration certificate. Horsepower remains the unit everyone understands, and manufacturers display it out of habit and for commercial convenience. Spec sheets for the British or American market use hp or bhp. The same motorcycle can therefore be quoted at “87.5 kW”, “119 PS” and “117 hp” without any contradiction.
Real horsepower and fiscal horsepower
In France, the registration certificate also shows an administrative power, expressed in “chevaux administratifs” and commonly called fiscal horsepower (CV). Despite its name, it is not a power at all: it is a tax quantity, used in particular to calculate the regional tax paid at registration, with each region setting the price per fiscal horsepower.
For a combustion-engined motorcycle, it depends only on engine displacement, according to the scale in Article L. 421-17 of the French tax code on goods and services (CIBS), which also applies to motorcycles registered before 2021:
| Displacement | Fiscal horsepower |
|---|---|
| up to 125 cc | 1 CV |
| 126 to 175 cc | 2 CV |
| 176 to 250 cc | 3 CV |
| 251 to 350 cc | 4 CV |
| 351 to 500 cc | 5 CV |
| over 500 cc | 5 + 8 × (displacement in litres − 0.5), rounded up |
A 689 cc Yamaha MT-07 therefore gives 5 + 8 × 0.189 = 6.5, rounded up to 7 CV. A 1,000 cc motorcycle is rated at 9 CV, whether it produces 100 PS or more than 200 PS. Fiscal horsepower therefore tells you nothing about a motorcycle’s performance. The formula based on CO₂ emissions and power that is sometimes quoted only ever applied to passenger cars first registered in France between July 1998 and the end of 2020; electric motorcycles have their own formula, based on motor power.
How to read power figures in road tests and official documents
A few pointers to avoid mistakes:
- on the manufacturer’s spec sheet, power is measured at the crankshaft, under type-approval conditions;
- on the French registration certificate, field P.2 shows maximum net power in kilowatts and field P.6 the administrative (fiscal) horsepower; for motorcycles, field Q also gives the power-to-weight ratio in kW/kg (P.2 and Q are harmonised EU fields, so you will find them on other EU registration documents too);
- in a road test, check whether the quoted power is the manufacturer’s figure or a dyno measurement, and if so whether it was taken at the rear wheel (the most common case in the press);
- for the A2 licence, the motorcycle must not exceed 35 kW (47.6 PS), its power-to-weight ratio must not exceed 0.2 kW/kg and, if it is restricted, the original version must not exceed 70 kW, twice the limit (EU Directive 2006/126/EC).
How are torque, power and engine speed related?
The physical relationship
Power equals torque multiplied by rotational speed:
P = T × ω
- P is power, in watts;
- T is torque, in newton-metres;
- ω (omega) is angular velocity, in radians per second.
The radian is the natural unit of angle in physics: one full revolution is 2π radians, about 6.283 radians.
From revolutions per minute to radians per second
Riders count in revolutions per minute. To convert to radians per second, multiply by 2π (one revolution = 2π radians) and divide by 60 (one minute = 60 seconds):
ω = engine speed × 2π ÷ 60
At 7,000 rpm, the crankshaft therefore turns at 7,000 × 6.283 ÷ 60 ≈ 733 rad/s.
A worked example
Back to our spec-sheet engine: 95 Nm at 7,000 rpm.
- P = 95 × 733 ≈ 69,640 W, or 69.6 kW;
- in metric horsepower: 69.6 × 1.36 ≈ 94.7 PS.
At 10,000 rpm, this engine must deliver 120 PS, or 88.3 kW. Its torque at that engine speed is therefore 88,300 ÷ (10,000 × 2π ÷ 60) ≈ 84 Nm. The spec sheet does not give this value, but physics dictates it.
For mental arithmetic, two practical formulas are enough:
- P (kW) = T (Nm) × engine speed (rpm) ÷ 9,549
- P (PS) = T (Nm) × engine speed (rpm) ÷ 7,024
Why peak torque and peak power do not coincide
Since power is the product of torque and engine speed, it could only peak at the same engine speed as torque if torque dropped abruptly right after its peak, which does not happen on a normal engine. At peak torque, torque stops rising, but engine speed keeps climbing: power still increases. The power peak is therefore always above the peak torque engine speed.
Why power keeps rising after peak torque
Beyond peak torque, cylinder filling gradually deteriorates: at high engine speeds, the air has less time to get in, and internal friction increases. Torque falls, but slowly at first. As long as this drop, in percentage terms, is smaller than the increase in engine speed, power rises. Peak power is reached when the two effects exactly balance.
And beyond the peak power engine speed?
Above the power peak, torque falls faster than engine speed rises: power decreases. Revving the engine higher no longer helps, except to avoid a gearchange just before braking. Higher still is the red line, then the rev limiter: the ECU cuts injection or ignition to protect the engine, whose moving parts (pistons, connecting rods, valves) are subjected to forces that increase very quickly with engine speed.
In practice, for maximum acceleration, riders often change up slightly after the peak power engine speed, so as to land, in the next gear, in a zone where power is still high.
How do you read torque and power curves?
The basic chart
Torque (orange, left scale) and power (blue, right scale) curves of a theoretical engine rated at 120 PS at 10,000 rpm and 95 Nm at 7,000 rpm. The curves are built for the example but respect the relationship P = T × ω.
Axes and units
- The horizontal axis shows engine speed, in rpm. It rarely starts at zero: an engine does not run below idle, and a dyno only measures from a stable engine speed.
- The left vertical axis shows torque, in Nm (or lb-ft on American charts).
- The right vertical axis shows power, in PS, kW or hp.
Both curves share the horizontal axis but not the vertical scales. The point where the two curves cross therefore has no physical meaning: it depends entirely on the scales chosen. On American charts, in hp and lb-ft, the curves always cross at 5,252 rpm, simply because that is the engine speed at which 1 lb-ft corresponds to 1 hp in that system of units.
Finding the peak values
- Peak torque is the highest point of the torque curve: here 95 Nm at 7,000 rpm.
- Peak power is the highest point of the power curve: here 120 PS at 10,000 rpm.
- The shaded area between them shows what physics dictates: torque falls, power still rises.
Understanding the shape of the curves
The power curve almost always looks the same: it rises steadily, rounds off and then falls after its peak. All the information about the engine’s character lies in the torque curve:
- its height shows the effort available;
- its width shows over what rev range that effort is available;
- its dips and humps reveal the irregularities you will feel through the throttle.
A dip in the torque curve also appears, in milder form, in the power curve: this is often what a road tester calls a midrange “hole”. These dips come from intake and exhaust tuning, or from noise and emissions constraints imposed by type approval.
What is a flat torque curve?
A “flat” torque curve stays close to its peak over a wide range, for example above 90% of peak torque between 3,500 and 8,000 rpm. Over such a range, power rises almost in proportion to engine speed, and the engine responds predictably: opening the throttle has roughly the same effect whatever the engine speed. This is what road testers call a flexible or linear engine.
Strong low down or concentrated at the top
Two theoretical engines with the same peak power, 100 PS. Engine A (solid line) reaches 99 Nm at around 5,500 rpm and its 100 PS at around 7,900 rpm. Engine B (dashed) only reaches 64 Nm at around 10,000 rpm and its 100 PS at around 11,350 rpm.
These two engines have the same peak power, but at 4,000 rpm engine A delivers about 55 PS and engine B only 21 PS. At 6,000 rpm, engine A still delivers twice as much: about 85 PS against 41 PS. On the road, where you often ride between 3,000 and 6,000 rpm, engine A will feel far stronger. To exploit engine B, you have to keep it above 9,000 rpm by changing down, which suits the track but much less a relaxed ride.
Why the shape matters more than the peaks
The two peak values on a spec sheet summarise two points on two curves. They say nothing about the width of the usable range, the dips, or the power actually available at the engine speed you ride at. When a road test or a manufacturer publishes the curves, look first at:
- torque between 3,000 and 6,000 rpm, the range of everyday riding;
- the width of the range where torque exceeds about 85 to 90% of its peak;
- any dips;
- the gap between the power peak and the red line, which shows how strong the top end is.
What do the phrases used in road tests mean?
Journalists use colourful vocabulary that almost always refers to the shape of the curves. Here is how to translate it.
“A torquey engine” Technically: an engine that delivers high torque, especially at low and medium engine speeds, relative to its displacement or to the weight of the motorcycle. At the handlebars: the motorcycle accelerates briskly as soon as you open the throttle, without needing to change down.
“Lots of low-down torque” Technically: the torque curve is already high at around 2,000 to 4,000 rpm. At the handlebars: you can ride in a high gear in town or on twisty roads, and the engine pulls without hesitation.
“A strong, full engine” Technically: a high torque curve with no dips over most of the usable range. At the handlebars: there is always a response under the throttle, whatever the engine speed.
“Weak at low revs” Technically: low torque at low engine speeds, or a marked dip at a specific engine speed. At the handlebars: below a certain engine speed, the motorcycle feels flat; you have to change down or slip the clutch to get acceleration.
“A linear engine” Technically: a power curve that rises steadily, without plateaus or sudden surges, often combined with a flat torque curve. At the handlebars: acceleration increases progressively with engine speed, without surprises. Reassuring, but some find it less exciting.
“A peaky engine” Technically: torque and power concentrated at high engine speeds, over a narrow band. At the handlebars: not much happens low down, then everything arrives at once at the top. You have to work the gear lever to stay in the right band.
“An engine that revs freely” Technically: an engine whose speed rises quickly, thanks to low inertia of the moving parts (crankshaft, flywheel, clutch) and enough torque at high engine speeds. At the handlebars: the rev counter needle climbs quickly and the engine easily reaches its red line.
“A strong top end” Technically: power that keeps rising, or holds, up to a high engine speed, with a comfortable gap between the power peak and the rev limiter. At the handlebars: you can hold a gear for a long time before changing up, for example to complete an overtake.
“A flexible engine” Technically: an engine that can run smoothly and pull from a very low engine speed in a high gear. At the handlebars: you can ride at 50 km/h in fifth or sixth gear without the transmission snatching, and accelerate again without changing down.
“A narrow powerband” Technically: the range of engine speeds where the engine delivers enough torque is short, for example from 8,000 to 12,000 rpm. At the handlebars: you have to change gear often to stay in this range, and choosing the wrong gear costs you response.
“An engine that pulls from low revs” Technically: torque and well-mapped fuel injection available from 2,000 to 3,000 rpm. At the handlebars: out of a corner or behind a lorry, you just open the throttle in the gear you are in and the motorcycle goes. This is what is meant by good roll-on acceleration.
“An engine that explodes at the top end” Technically: a rapid, marked rise in torque and power at high engine speeds, often linked to intake, exhaust or valve timing settings that favour cylinder filling at high revs. At the handlebars: above a certain engine speed, the thrust increases sharply, sometimes to the point of lifting the front wheel. Spectacular, but harder to manage on a wet road.
Torque or power: what determines acceleration?
From crankshaft to rear wheel
The torque produced by the engine passes through three reduction stages before reaching the wheel:
- the primary drive, between the crankshaft and the clutch;
- the gearbox, whose ratio depends on the gear selected;
- the final drive, by chain, belt or shaft, between the gearbox output and the rear wheel.
At each stage, rotational speed is divided and torque multiplied by the same factor, minus losses. Since a gearbox does not create energy, power stays the same: it only changes form.
Real example: Kawasaki Z650RS ratios (primary 2.095, first gear 2.438, sixth gear 0.852, final drive 3.067; Kawasaki France data) at the peak torque engine speed, 64 Nm at 6,700 rpm. Transmission losses ignored.
Engine torque and wheel torque
On this Z650RS, the overall reduction is about 15.7 in first gear and 5.5 in sixth. The engine’s 64 Nm therefore become about 1,000 Nm at the wheel in first gear, but only 350 Nm in sixth. Divided by the wheel radius (about 0.31 m with a 160/60-17 tyre), that gives a thrust at the contact patch of about 3,230 N in first gear and 1,130 N in sixth.
That is why engine torque alone says little about acceleration: it is wheel torque that pushes the motorcycle, and it depends as much on the transmission as on the engine.
Gearing trades force for speed
At the same engine speed of 6,700 rpm, the Z650RS travels at about 50 km/h in first gear and about 143 km/h in sixth. In both cases, the engine delivers the same power, about 45 kW: in first gear, a lot of force at low speed; in sixth, less force at high speed. Multiply force by speed and you get the same power.
The role of power in acceleration
At a given speed, the maximum force that can push the motorcycle equals the available power divided by the speed (minus losses). That is why power, not engine torque, sets the acceleration capability at a given speed, provided you are in the right gear.
Example: at 100 km/h (27.8 m/s), a 54 kW engine, that of the MT-07, can deliver at most about 1,940 N of thrust, if its engine speed is close to the power peak. A 70 kW engine, that of the Trident 660, can deliver about 2,520 N. Yet both motorcycles claim the same 68 Nm of peak torque. The difference comes from engine speed: the Trident’s engine delivers its torque higher up the rev range, and each extra revolution per second translates into more power. To benefit from it, you have to keep it at those high engine speeds, in the right gear.
The influence of engine speed and gear selected
At any given moment, acceleration depends on the power actually available at the engine speed the engine is turning, and therefore on the gear selected. If you ride at 100 km/h in sixth at 5,000 rpm, you are using only a fraction of peak power. Changing down to fourth raises engine speed towards the power band: acceleration is stronger, with the same engine and at the same road speed. That is exactly what a rider does before overtaking.
Why more torque does not necessarily mean more acceleration
The BMW R 1300 GS claims 149 Nm, the BMW S 1000 RR “only” 113 Nm. Yet the sports bike produces 210 PS against 145 PS and weighs 198 kg against 237 kg ready to ride: its acceleration capability is far greater. Its engine delivers less torque, but it revs much higher (peak power at 13,750 rpm against 7,750 rpm). A very torquey engine is not necessarily a better-performing one: with comparable weight and aerodynamics, it is the available power that determines the possible acceleration.
The GS’s high low-down torque is still a real asset, but of a different kind: it provides immediate thrust without having to rev the engine, which is valuable off-road, two-up or fully loaded.
Weight, grip and electronics
The same thrust accelerates a lighter motorcycle more: this is Newton’s second law, acceleration = force ÷ mass. You must count the weight of the motorcycle and that of the rider, which proportionally penalises small-capacity bikes more.
At low speed, in the first gears, the limit is often not the engine but the grip of the rear tyre and wheelies: a powerful motorcycle lifts its front wheel well before it has used all its power. That is where traction control, wheelie control and, on sports bikes, launch control come in. They limit thrust to what the motorcycle can transmit to the road without losing control.
Acceleration, roll-on and top speed
Three notions are often confused:
- standing-start acceleration (0 to 100 km/h, quarter mile) depends on power, weight, grip, electronics and how quickly gears are changed;
- roll-on acceleration (for example from 80 to 120 km/h in fifth gear) depends on the torque available at low and medium engine speeds and on gear ratios: this is where an engine with strong low-down torque stands out;
- top speed depends mainly on peak power and aerodynamics. Air resistance increases with the square of speed, and the power needed to overcome it with the cube of speed: at high speed, where air resistance dominates, riding 10% faster requires about 33% more power.
Why do some engines favour torque and others power?
The influence of displacement
As we saw with brake mean effective pressure: with comparable technology, peak torque is roughly proportional to displacement. Power also depends on the engine speed at which the engine can run. A large-displacement engine therefore starts with a torque advantage, but not necessarily a power advantage.
The influence of engine layout
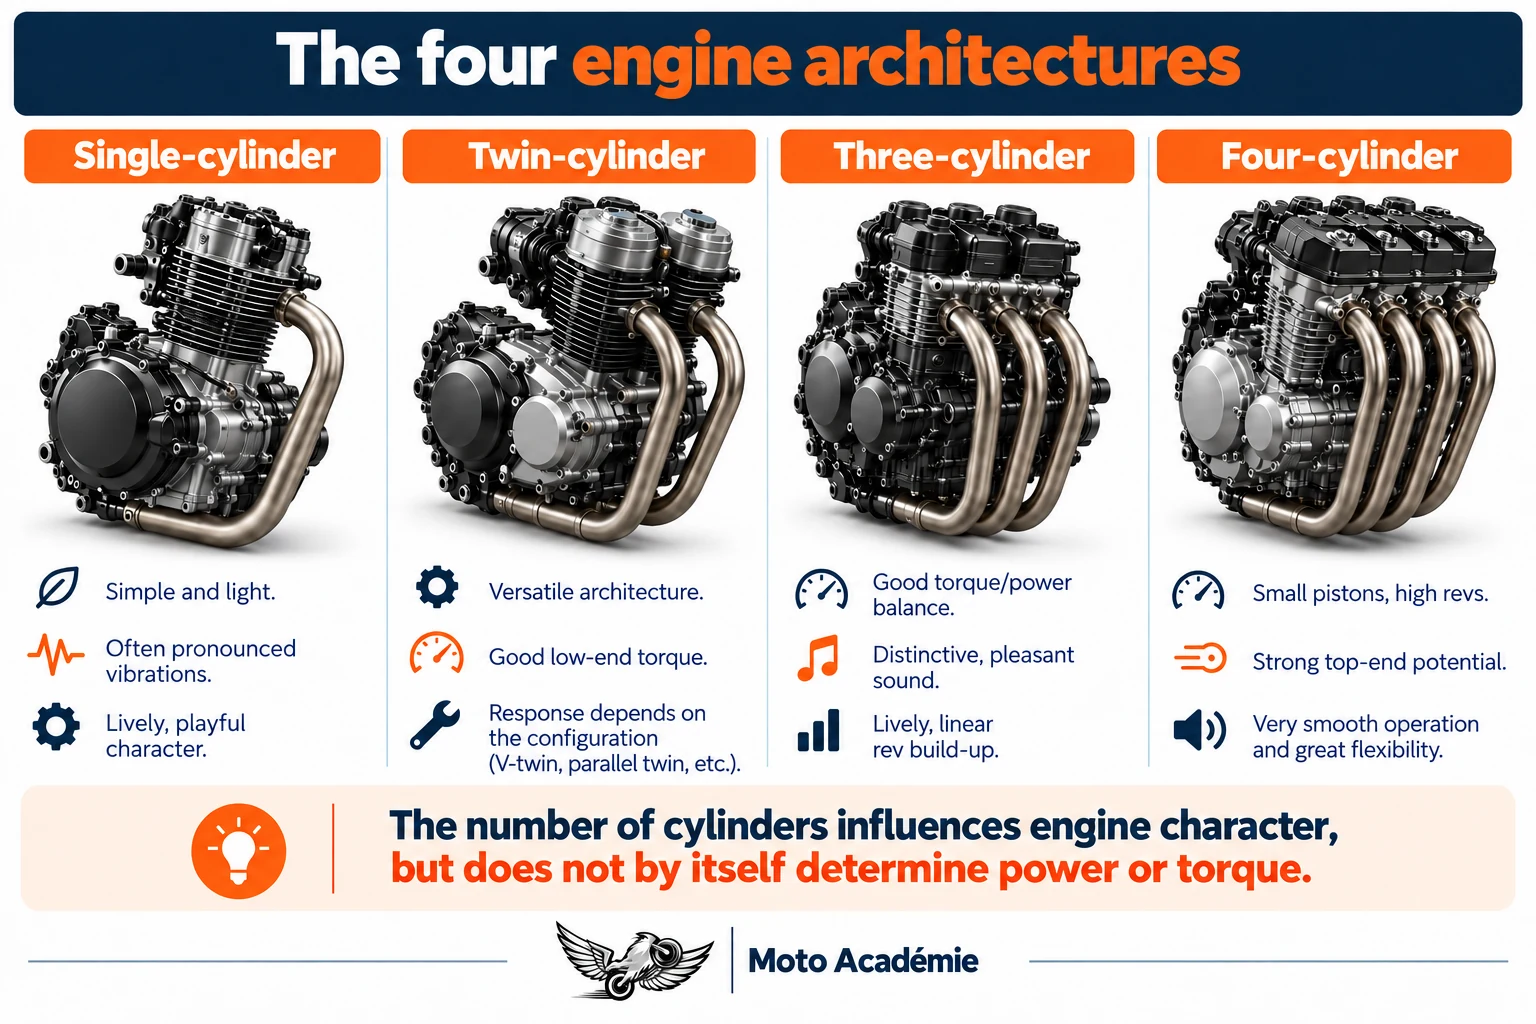
The number of cylinders acts mostly indirectly:
- The single concentrates all the displacement in one piston, which becomes heavy as displacement increases. It tends to rev lower, to produce marked pulses at very low engine speeds and to vibrate more. It is found mainly on small-capacity bikes, light adventure bikes and off-road machines.
- The twin is the most common compromise. Depending on its crank angle (180°, 270° or 90° V), it produces very different sensations, from a regular hum to marked pulses.
- The triple often combines good midrange torque with the ability to rev high, with a distinctive sound.
- The four allows, for the same displacement, smaller and lighter pistons, hence higher engine speeds and more power. It is the layout of most 1,000 cc sports bikes.
But layout is not everything. The four-cylinder Honda CBR650R and the three-cylinder Triumph Trident 660 both produce 95 PS from similar displacements (649 and 660 cc), with peak torque of 63 Nm at 9,500 rpm for the first and 68 Nm at 8,250 rpm for the second.
The influence of maximum engine speed
For the same torque, an engine that turns twice as fast delivers twice as much power. Sports bike engines are designed to rev very high: the BMW S 1000 RR reaches peak power at 13,750 rpm. An adventure or touring engine can make do with 7,000 to 9,000 rpm.
Bore, stroke and valve train
The ratio between bore (cylinder diameter) and stroke (distance travelled by the piston) strongly influences the possible engine speed:
- a short-stroke engine (bore much larger than stroke, called “oversquare”) can rev very fast without the pistons reaching excessive speeds, and has room for large valves;
- a long-stroke engine sees its mean piston speed rise quickly with engine speed, which limits its maximum engine speed, but it often favours low-down torque and part-load combustion.
Mean piston speed, equal to 2 × stroke × engine speed ÷ 60, gives an idea: at the peak power engine speed, it reaches about 18 m/s for the Honda NC750X (77 × 80 mm, at 6,750 rpm) and about 22.8 m/s for the BMW S 1000 RR (80 × 49.7 mm, at 13,750 rpm). The sports bike engine turns twice as fast with a much shorter stroke. These values are calculated from manufacturers’ spec sheets.
The valve train also plays a part: valve lift and opening duration (the cam profile), number of valves and sometimes variable valve timing, such as the VVA system on the Yamaha R125, which switches cams at high engine speeds.
Intake, exhaust and engine management
The length and diameter of the intake and exhaust ducts create pressure waves that favour cylinder filling at some engine speeds and impair it at others. Electronic management (injection, ignition, electronically controlled throttle bodies) then makes it possible to adjust the response, limit torque in certain gears or adapt the engine to a restricted version. Triumph, for example, offers a Tiger 900 GT Pro A2 whose engine is remapped to 95 PS instead of 108 PS, before the 35 kW restrictor kit is even fitted.
A larger engine is not necessarily more powerful
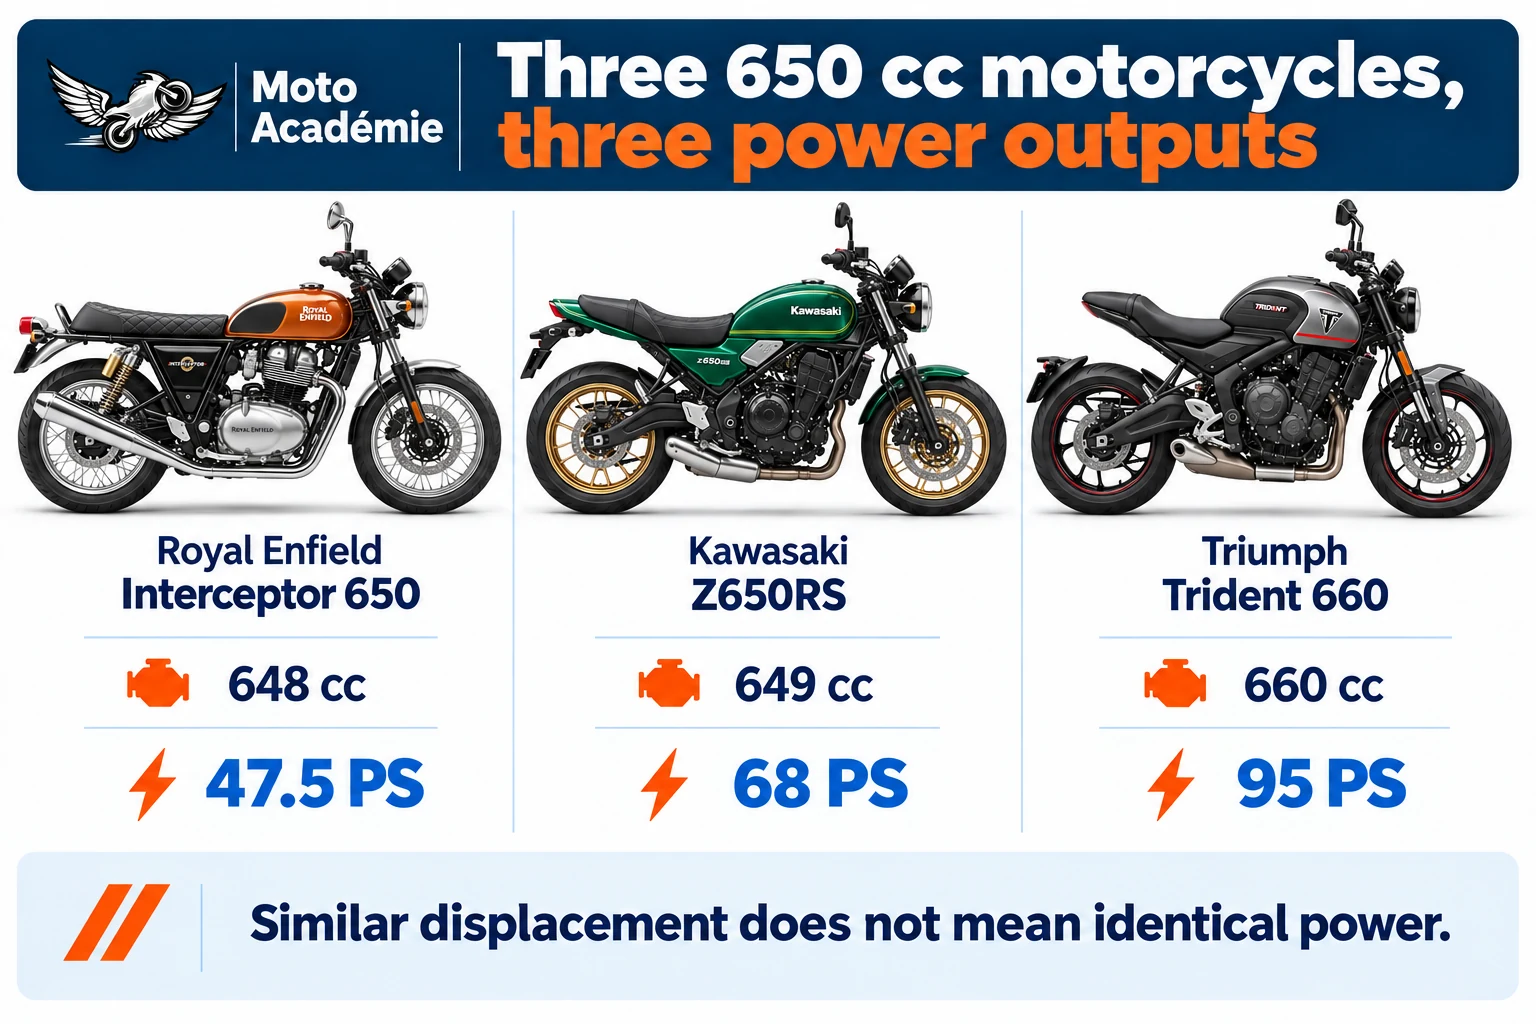
Three motorcycles of about 650 cc show this clearly:
| Motorcycle | Displacement | Layout | Power | Torque |
|---|---|---|---|---|
| Royal Enfield Interceptor 650 | 648 cc | air/oil-cooled twin | 47.5 PS at 7,250 rpm | 52.3 Nm at 5,150 rpm |
| Kawasaki Z650RS | 649 cc | liquid-cooled twin | 68 PS at 8,000 rpm | 64 Nm at 6,700 rpm |
| Triumph Trident 660 | 660 cc | liquid-cooled triple | 95 PS at 11,250 rpm | 68 Nm at 8,250 rpm |
Same displacement, twice the power from one end to the other. Peak torque varies much less (from 52 to 68 Nm) than power, because what mainly differs is the operating engine speed.
Low revs or high revs: two philosophies
An engine designed for low and medium engine speeds favours flexibility, economy and pleasant response: a rather long stroke, little valve overlap, a heavy flywheel, a low red line. A sports engine favours peak power: short stroke, large valves, more aggressive valve timing, light parts, a high red line. The first is often more pleasant every day, the second more effective on the track.
Beware of generalisations
“A twin has torque, a four has nothing low down”: the phrase is too simple. A large-displacement four can be very torquey, and a sports twin can be peaky. What matters is the actual curve, not the number of cylinders.
Why can two motorcycles with the same power feel different?
Take three motorcycles accessible on an A2 licence, with almost identical power:
| Motorcycle | Engine | Power | Torque | Claimed weight |
|---|---|---|---|---|
| Royal Enfield Interceptor 650 | 648 cc twin | 47.5 PS at 7,250 rpm | 52.3 Nm at 5,150 rpm | 217 kg ready to ride |
| Honda CB500 Hornet | 471 cc twin | 47.6 PS at 8,500 rpm | 43 Nm at 6,500 rpm | 188 kg ready to ride |
| Kawasaki Ninja 500 | 451 cc twin | 45 PS at 9,000 rpm | 42.6 Nm at 6,000 rpm | 171 kg wet |
On paper, peak power is the same to within 2.6 PS. At the handlebars, these motorcycles are nothing alike.
The shape of the curves
The Interceptor gets more torque, earlier, thanks to its larger displacement: it pulls from low engine speeds and does not need to be revved. The two 500s deliver less torque, higher up: you have to rev them more to get the same power.
Displacement and layout
A large long-stroke twin turns more slowly, with fewer, stronger combustion events: the feeling of thrust is different from that of a smaller engine revving higher, even at equal power.
Gearing and gear ratios
The manufacturer matches the gearbox and final drive to the engine. An engine that revs high gets shorter gearing so that its useful engine speeds match everyday road speeds. The spacing of the gears, that is the gap between two successive ratios, also determines the drop in engine speed at each upshift.
Weight
The Interceptor weighs 217 kg, the Ninja 500 171 kg. At equal power, the Ninja therefore has about 3.8 kg to move per PS, against 4.6 kg for the Interceptor. With an 80 kg rider the gap narrows, but it remains noticeable under acceleration.
Throttle response
How the engine responds to a small movement of the twistgrip depends on fuel-injection mapping, the throttle mechanism or electronic throttle control, and engine inertia. A sharp response gives an impression of power; a softer response feels less energetic while sometimes being more effective.
Electronic management and riding modes
Many motorcycles offer several riding modes. They generally change throttle response and sometimes peak power or torque in the lower gears. The same motorcycle can thus feel docile in Rain mode and aggressive in Sport mode, with exactly the same spec sheet.
Vibration, sound and mechanical feel
Vibration, intake and exhaust noise, the pulses of a twin or the howl of a four contribute a great deal to the impression of power. A smooth, quiet engine often feels slower than it really is.
Feelings are not a stopwatch
A peaky engine, whose thrust arrives all at once at the top end, often gives a stronger impression of brutality than a linear engine, even if the latter accelerates just as hard over the same distance. Conversely, a very smooth, very linear engine can feel slower than it is. That is why serious road tests measure acceleration and roll-on times instead of relying on impressions.
How are a motorcycle’s power and torque measured?
The engine dynamometer
On an engine dyno, the engine is removed from the motorcycle and connected to a brake: electromagnetic (eddy current), hydraulic or electric. The brake applies an adjustable resisting torque. A load cell measures the force on the brake housing at the end of a known lever arm, which gives torque directly. Power is then calculated from torque and engine speed, using P = T × ω. This is the method used by manufacturers and for type approval: claimed power is measured at the crankshaft.
The chassis dynamometer
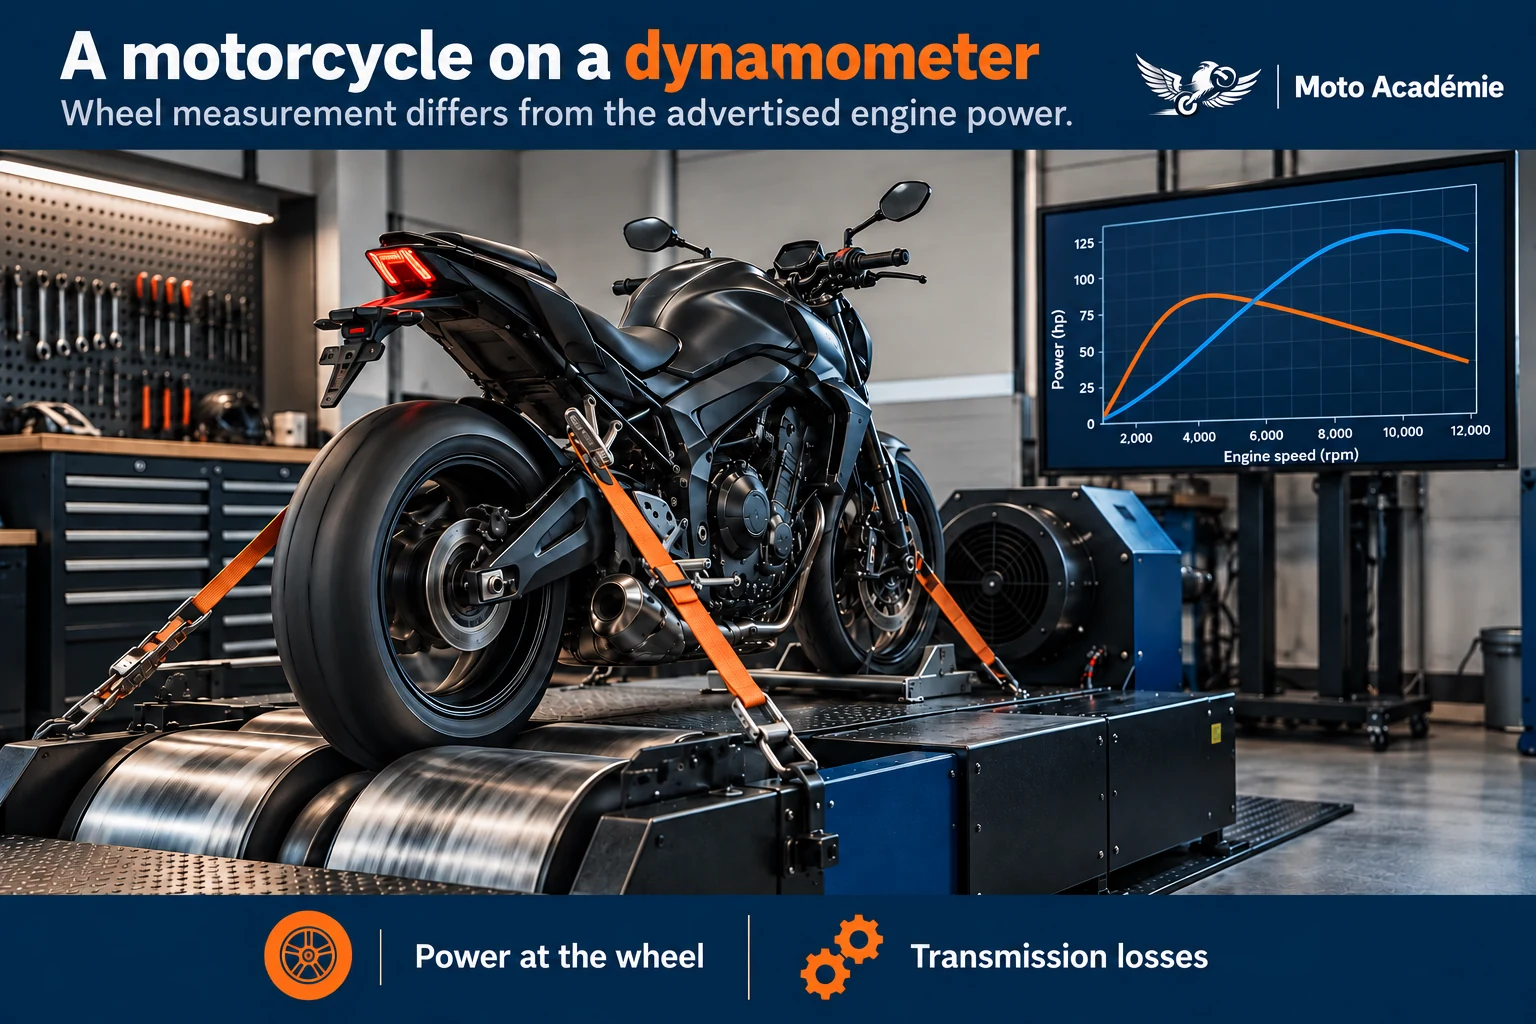
Magazines and tuners mostly use chassis dynos: the whole motorcycle is strapped down with its rear wheel on a roller.
- The inertia dyno: the roller is very heavy and has a known inertia. The rider accelerates at full throttle in a given gear; the dyno measures the roller’s acceleration and deduces the power transmitted at each instant.
- The brake dyno: the roller is braked by a retarder, which makes it possible to hold engine speed steady and measure wheel torque point by point.
The dyno knows engine speed from a sensor or from the ratio between roller speed and engine speed. It can then plot a torque curve referred back to the engine, by dividing wheel torque by the overall reduction.
Crankshaft power and rear-wheel power
A chassis dyno measures power at the rear wheel, after the primary drive, gearbox, chain and tyre. Each component dissipates part of the energy as friction and heat. Rear-wheel power is therefore always lower than the crankshaft power claimed by the manufacturer.
Losses between the crankshaft and the rear wheel of a chain-driven motorcycle are in the region of 10 to 15%, depending on the transmission, the tyre and the dyno. In 1996, engineer Kevin Cameron broke them down in Cycle World: about 2% for the primary drive, 2% for the gearbox, 3% for the chain and sprockets, then an extra share absorbed by the tyre on a roller dyno, for a total of around 15%. The standard efficiencies set by EU regulations to convert a measurement back to the crankshaft (0.98 for a spur gear, 0.95 for a roller chain) give a similar order of magnitude: about 9% lost before the tyre.
Two published measurements illustrate this:
- Cycle World recorded 106 hp at 10,000 rpm and 86.1 Nm (63.5 lb-ft) at 7,000 rpm at the rear wheel of a 2022 Yamaha XSR900, rated at 119 PS (117.3 hp) and 93 Nm at the crankshaft: the wheel receives about 90% of the claimed power and 93% of the claimed torque;
- Motorcycle.com measured 89.9 hp at 11,300 rpm and 60.3 Nm (44.5 lb-ft) at 9,800 rpm on a US-spec 2026 Aprilia RS 660 Factory, rated at 105 PS (103.5 hp) and 70 Nm: about 87% and 86%.
These gaps combine transmission losses, differences in dyno and correction method, and sometimes market-specific engine settings: they do not measure mechanical losses alone.
How torque is measured or calculated
On a brake-type engine dyno, torque is measured directly. On an inertia dyno, power is deduced from the roller’s acceleration, and torque is calculated by dividing that power by rotational speed. In both cases, the torque and power curves from the same test are linked by P = T × ω: they are not two independent measurements.
Test conditions and correction methods
The power of a naturally aspirated engine depends on the density of the air it draws in: in hot weather or at altitude, the air is less dense and the engine loses power. To compare measurements taken in different conditions, they are corrected to reference conditions by a correction factor.
For motorcycle type approval in the EU, Delegated Regulation (EU) No 134/2014 requires a measurement at the crankshaft, at full load, corrected to 25 °C and 99 kPa dry air pressure. It also sets a tolerance: above 11 kW, the maximum torque and maximum power determined during type approval may differ by no more than 2%. The international standard ISO 1585 uses the same reference conditions. The old German DIN 70020 standard corrected power to 20 °C and 1,013 mbar: colder, denser reference air, which gives a higher corrected figure for the same engine. In the United States, the SAE J1349 standard is the reference. A power figure is therefore only meaningful together with its method: where it was measured (crankshaft or wheel) and which correction was applied.
Why independent measurements differ from claimed figures
Several factors add up: measurement at the wheel rather than the crankshaft, the correction standard used, engine and air temperature, the condition of the motorcycle (running-in, tyres, chain tension), the version of the model (a motorcycle sold in the United States does not always have exactly the same mapping as in Europe) and production variation from one example to another.
The limits of comparing different dynos
Two dynos from different makers, or the same dyno with a different correction factor, can give noticeably different results on the same motorcycle. A comparison is only valid if the measurements were taken on the same dyno, with the same correction and the same procedure, ideally on the same day. Between different dynos, compare the shape of the curves rather than the absolute values.
How do you compare two motorcycles’ performance intelligently?
Peak power is not enough
Peak power tells you about top speed and full-throttle performance at high revs. It says nothing about the power available at 4,000 rpm, where you spend much of your time on the road.
Look at torque across the range you actually use
The best indicator of everyday behaviour is the torque available, or better still the power available, across the rev range you really use. When the curves are not published, the peak torque engine speed gives a first clue: peak torque at 5,000 rpm suggests an engine with more pull low down than peak torque at 9,500 rpm.
The power-to-weight ratio
The power-to-weight ratio, expressed here in kilograms per PS, shows how much mass each horsepower has to move. The lower it is, the better the performance, all else being equal:
| Motorcycle | Claimed weight | Power | Ratio |
|---|---|---|---|
| BMW S 1000 RR | 198 kg | 210 PS | 0.94 kg/PS |
| BMW R 1300 GS | 237 kg | 145 PS | 1.63 kg/PS |
| Triumph Trident 660 | 195 kg | 95 PS | 2.05 kg/PS |
| Yamaha MT-07 | 183 kg | 73.4 PS | 2.49 kg/PS |
| Honda CB500 Hornet | 188 kg | 47.6 PS | 3.95 kg/PS |
| Royal Enfield Interceptor 650 | 217 kg | 47.5 PS | 4.57 kg/PS |
Beware: manufacturers do not all quote weight in the same conditions (dry, ready to ride, tank 90% full), which can skew the comparison by a few kilos. Add your own weight too: with an 80 kg rider, the gap between a light and a heavy motorcycle shrinks proportionally.
The influence of the transmission
With the same engine, shorter gearing improves acceleration and roll-on, at the cost of higher engine speeds on the motorway and sometimes a lower top speed. Tuners often change the rear sprocket or the gearbox output sprocket for this reason.
Theoretical and measured performance
Manufacturers’ figures are type-approval values at the crankshaft. Road tests measure real performance, at the wheel, with a rider and under given conditions. Both are useful, but they cannot be compared directly. For acceleration, a 0 to 100 km/h or quarter-mile time measured by the same magazine in identical conditions is worth more than any calculation.
Example: Yamaha MT-07 versus Triumph Trident 660
| Yamaha MT-07 | Triumph Trident 660 | |
|---|---|---|
| Engine | 689 cc twin | 660 cc triple |
| Power | 73.4 PS at 8,750 rpm | 95 PS at 11,250 rpm |
| Torque | 68 Nm at 6,500 rpm | 68 Nm at 8,250 rpm |
| Claimed weight | 183 kg wet | 195 kg wet |
| Power-to-weight ratio | 2.49 kg/PS | 2.05 kg/PS |
Manufacturers’ data.
Same peak torque, but not at the same engine speed. At full throttle, using the revs, the Trident performs better: almost 22 PS more for 12 kg more. In the midrange, however, the MT-07 delivers its peak torque 1,750 rpm earlier, in a lighter motorcycle. On a twisty road ridden between 4,000 and 7,000 rpm, the gap in power actually available is therefore probably much smaller than the 22 PS on paper. Only curves measured on the same dyno could put a number on it.
Why a less powerful motorcycle can feel livelier
A less powerful motorcycle can feel livelier if it is lighter, if its gearing is shorter, if its throttle response is more direct, if its engine delivers more torque at the engine speed you are riding at or if its torque arrives more abruptly. On the road, at 70 km/h in third gear, a sports bike’s peak power is simply not available: all that counts is what the engine delivers at that engine speed.
Which figures to look at for your riding
- In town: low-down torque, flexibility, smooth throttle response and weight. Peak power hardly matters.
- On the road: torque and power between 3,000 and 7,000 rpm, roll-on in the intermediate gears, power-to-weight ratio.
- Touring: low and medium-rpm torque for riding loaded and two-up, roll-on in top gear, fuel consumption.
- Sporty road riding: power and power-to-weight ratio, but also linear response, which makes the motorcycle easier to exploit.
- On the track: peak power, top-end strength, power-to-weight ratio and the quality of the electronic aids that let you use that power.
The figures do not tell an engine’s whole story
Torque is a turning effort, power a rate of energy flow. They are linked by engine speed: power is torque multiplied by rotational speed. That is why an engine can gain power by revving higher while its torque falls, and why the two peaks never occur at the same engine speed.
The two values on a spec sheet only summarise two points on two curves. They say nothing about the width of the usable range, the dips, or how the transmission multiplies torque before it reaches the wheel. To understand a motorcycle’s character, the torque and power curves, the gear ratios and the weight say far more than the peaks.
Finally, riding pleasure depends on factors no figure captures: throttle response, sound, vibration, riding position, chassis. “100 horsepower” and “90 Nm” are a starting point for comparison, not a verdict. The only way to know whether an engine suits you is still to ride it.